
TL;DR:
- Small businesses waste up to half their marketing budget by guessing instead of measuring results.
- Analytics help identify effective channels, improve targeting, and optimize marketing spend.
- Focusing on actionable insights rather than vanity metrics accelerates growth and ROI.
Most small businesses waste up to half their marketing budget because they guess instead of measure. If you’ve ever boosted a social post without knowing if it drove sales, or ran ads without tracking conversions, you already know the frustration. The good news? Analytics provide visibility into which channels actually produce results, and today’s tools make that visibility affordable and accessible. This guide breaks down what analytics really mean, which types matter most, and how to turn raw data into decisions that grow your business without burning your budget.
Table of Contents
- What analytics actually mean for small businesses
- The four types of analytics and what they reveal
- Turning insights into action: Practical examples
- The limits, pitfalls, and how to avoid analytics mistakes
- Our perspective: Analytics are powerful, but not a magic bullet
- Ready to turn analytics into results?
- Frequently asked questions
Key Takeaways
| Point | Details |
|---|---|
| Stop guessing, start measuring | Affordable analytics turn digital marketing from guesswork into a strategic, money-saving process. |
| Choose the right analytics | Understanding descriptive, diagnostic, predictive, and prescriptive analytics helps you make smarter business moves. |
| Act on insights | Turning data into action—like reallocating budgets—boosts ROI and sales for small businesses. |
| Avoid common traps | Focus on meaningful metrics and clean data to prevent wasted time and money. |
What analytics actually mean for small businesses
A lot of small business owners hear the word “analytics” and picture a team of data scientists staring at complex dashboards. That image is wrong, and it’s costing you money. Analytics simply means gathering information about how people interact with your business online, then using that information to make smarter choices.
The data points you’ll work with most include:
- Traffic sources: Where your website visitors come from (Google, social media, email, direct)
- User actions: What people click, read, or watch on your site
- Conversions: How many visitors take a desired action, like buying or calling
- Revenue attribution: Which marketing channel gets credit for a sale
These aren’t abstract numbers. They’re answers to real questions like “Is my Facebook ad actually bringing in customers?” or “Why do people leave my website without buying?”
“Analytics enable small businesses to shift from guesswork to data-driven decisions in digital marketing.”
One of the biggest myths is that analytics tools are expensive or reserved for big brands. Google Analytics 4 is completely free. Facebook Insights is built into every business page. Even basic email platforms show open rates and click-through data at no extra cost. You can explore Google Analytics basics without any technical background and start seeing useful patterns within days.
Another myth is that you need a lot of data before analytics become useful. In reality, even a small sample of clean data beats a large pile of assumptions. When you stop relying on gut feeling and start reading what your customers actually do, your marketing spend gets sharper. You stop paying for channels that don’t convert and put more behind the ones that do. Understanding the importance of digital marketing for small business starts with knowing what’s working and what’s draining your budget.
The shift from gut-feeling to data-backed decisions doesn’t require a full-time analyst. It requires consistency: check your numbers weekly, ask one focused question at a time, and act on what you find.
The four types of analytics and what they reveal
Not all analytics ask the same question. There are four distinct methodologies, and each one gives you a different kind of business intelligence. Analytics methodologies include descriptive, diagnostic, predictive, and prescriptive approaches, and each plays a specific role in your marketing strategy.
| Type | Question it answers | Business example |
|---|---|---|
| Descriptive | What happened? | Monthly sales report, traffic summary |
| Diagnostic | Why did it happen? | Traffic drop after a website change |
| Predictive | What will happen? | Demand forecast for next quarter |
| Prescriptive | What should we do? | Which ad to increase or cut |
Here’s how each type works in practice:
- Descriptive analytics gives you a snapshot of the past. Think of it as your business report card. It tells you how many people visited your site last month, which pages they viewed, and how long they stayed.
- Diagnostic analytics goes one level deeper. When sales dropped in March, diagnostic data helps you figure out why. Maybe a key landing page broke on mobile. Maybe a competitor ran a big promotion.
- Predictive analytics uses historical patterns to forecast what comes next. If your data shows a spike in demand every October, you can plan inventory and ad spend accordingly.
- Prescriptive analytics is the most action-oriented. It combines past data and predictions to recommend specific moves, like shifting 20% of your ad budget from display ads to search ads based on conversion trends.
You don’t need to master all four at once. Start with descriptive and diagnostic to understand your baseline. Then layer in predictive thinking as you build website analytics for business growth over time. When you’re ready to go further, online analytics for business can guide your next level of strategy.
Pro Tip: Pick one question per week to answer with your data. “Which page has the highest exit rate?” is more useful than staring at 50 metrics at once.
Turning insights into action: Practical examples
Understanding analytics frameworks is valuable, but what does application look like day-to-day for small businesses? The answer is simpler than most people expect.
Here’s a straightforward process to follow:
- Set up tracking: Install GA4 on your website. Link it to your Google Ads account if you run paid campaigns.
- Segment by traffic source: Separate organic search, paid ads, social media, and direct traffic. Each behaves differently.
- Identify your best converters: Which source sends visitors who actually buy or call? Focus your budget there.
- Adjust spend: Move budget away from low-converting sources. Even a 10% reallocation can meaningfully improve ROI.
- Repeat monthly: Analytics is not a one-time setup. It’s a habit.
Start with free tools like GA4 to track conversions, segment by channel and device, and use multi-touch attribution to understand which combination of touchpoints leads to a sale.

| Before analytics | After analytics |
|---|---|
| Budget split evenly across all channels | Budget focused on top-converting channels |
| No visibility into what drives sales | Clear picture of revenue attribution |
| Campaigns run until money runs out | Campaigns adjusted based on performance data |
| Website issues go unnoticed | Funnel drop-offs identified and fixed |
Facebook Insights is another practical starting point. It shows you which posts your audience engages with most, what time of day they’re active, and which demographics respond to your content. Combine that with your website data and you start seeing the full customer journey.
Some quick wins most small businesses can act on immediately include fixing high-exit pages, doubling down on the social platform that drives the most traffic, and pausing ads with zero conversions. Learning to track marketing ROI doesn’t require a big budget. It requires paying attention. Pair that with affordable marketing tactics and you have a lean, effective growth engine.
Pro Tip: Set up conversion goals in GA4 before you launch any campaign. Without goals, you’re collecting data but not measuring what actually matters.
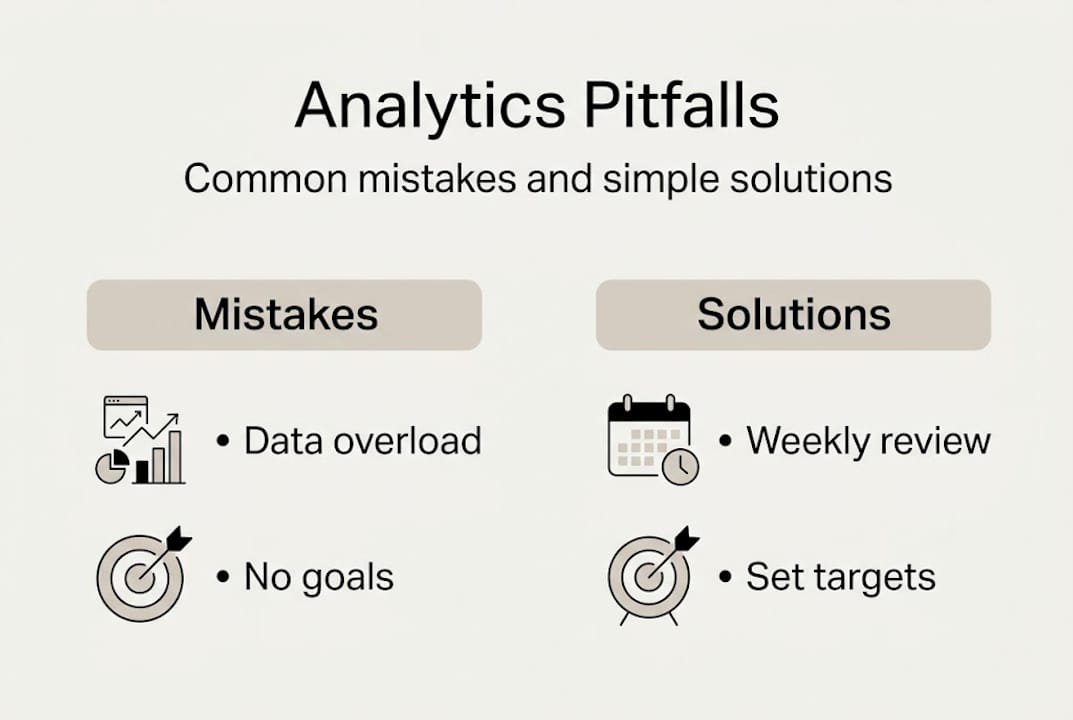
The limits, pitfalls, and how to avoid analytics mistakes
As you add analytics to your business, it’s essential to know what can go wrong so you spend your time and money where it counts.
The most common trap is vanity metrics. These are numbers that look impressive but don’t connect to revenue. Page views, social media followers, and email open rates can all feel like progress while your sales stay flat. The fix is simple: always ask “does this metric tell me if I’m making money?”
“Vanity metrics mislead; attribution issues can lead to wasted spend; clean data is essential.”
Here are the most common analytics mistakes and how to avoid them:
- Misattribution: Giving credit for a sale to the wrong channel. Use multi-touch attribution models in GA4 to see the full picture.
- Poor data hygiene: Spam traffic, bot visits, and duplicate tracking codes inflate your numbers. Audit your setup every quarter.
- No regular review: Data only helps if you look at it. Block 30 minutes every week to check your key metrics.
- Chasing too many metrics: Pick 3 to 5 KPIs (key performance indicators) that directly tie to your goals. More is not better.
- Skipping human interpretation: Dashboards can’t tell you why a customer chose you. Combine data with customer conversations.
The reality is that 73% of eCommerce businesses lack actionable dashboards despite collecting data. They have the numbers but not the structure to use them. Setting up real-time analytics for small business with a clean, focused dashboard solves this problem before it starts.
Analytics also requires time and context. A traffic spike in one week might mean your content went viral, or it might mean a bot crawled your site. Numbers without context lead to bad decisions.
Our perspective: Analytics are powerful, but not a magic bullet
We’ve worked with small businesses that had access to excellent analytics tools and still struggled to grow. The data was there. The dashboards were clean. But nothing changed because no one acted on the insights.
Here’s the uncomfortable truth: analytics give you direction, but they don’t do the work. Growth still requires creativity, customer empathy, and the willingness to test ideas that might fail. The businesses that win are the ones that treat data as a starting point, not a final answer.
The other mistake we see often is data overwhelm. Business owners set up five tools, connect them all, and end up with so much information that they freeze. Start with one platform. Answer one question. Make one change. That’s how momentum builds.
Pair analytics with AI for predictive analysis, but remember that humans are still needed for context and action. A dashboard can tell you that conversions dropped 15% on mobile. It can’t tell you that your checkout button is hard to tap on small screens until a real person tests it.
The businesses we’ve seen grow fastest treat analytics as a feedback loop, not a report card. They test, learn, adjust, and repeat. Explore affordable digital marketing perspective to see how this mindset scales even on a tight budget.
Ready to turn analytics into results?
You now have a clear picture of what analytics are, how the four types work, and where most small businesses go wrong. The next step is putting it into practice.
At ibrand.media, we help small businesses move from data confusion to confident, revenue-focused decisions. Whether you’re just getting started or want to sharpen an existing strategy, our team builds personalized plans around your goals and budget. Start by learning how to optimize your website for search, then explore how to boost local sales with SEO, and discover the social media management benefits that compound over time. Real results come from combining smart analytics with expert execution.
Frequently asked questions
How do analytics help me save money on marketing?
Analytics show which marketing channels generate the most sales, so you can reallocate budget away from low-performing campaigns and focus spend where it actually converts.
What’s the easiest analytic tool for a small business to start with?
Google Analytics 4 is a free, beginner-friendly option that lets you track conversions, monitor traffic sources, and understand user behavior without any technical expertise.
What are vanity metrics and why should I avoid them?
Vanity metrics are numbers like page views or follower counts that look good but don’t connect to revenue. Focus on actionable metrics like conversions and cost per acquisition instead.
How much time does it take to see results from using analytics?
You can spot useful patterns within weeks, but meaningful ROI improvements typically take a few months of consistent tracking and regular campaign adjustments to show up in your bottom line.
Recent Comments