
Over half of all websites fail to meet Google’s current performance standards, and most business owners have no idea their site is one of them. According to 2025 benchmarks, only 48% of mobile sites pass all three Core Web Vitals tests. That means your competitors may be quietly outranking you, not because of better products or smarter marketing, but because their pages load faster and feel smoother. This guide breaks down what website performance metrics are, why they matter for your SEO and sales, and exactly what you can do to fix them.
Table of Contents
- What are website performance metrics?
- How site performance impacts SEO and sales
- A closer look at Core Web Vitals
- Website performance monitoring tools compared
- How to improve website performance: best practices
- Ready to turn performance into profit?
- Frequently asked questions
Key Takeaways
| Point | Details |
|---|---|
| Core Web Vitals matter | Metrics like LCP, INP, and CLS directly impact SEO and sales for your business. |
| Mobile performance lags | Your site’s mobile experience often falls behind desktop, costing you traffic and conversions. |
| Use the right tools | PageSpeed Insights, Lighthouse, and others help you monitor and improve performance. |
| Continuous action required | Monitor performance regularly and set practical improvement goals for lasting success. |
What are website performance metrics?
Website performance metrics are measurable signals that tell you how fast, stable, and responsive your site feels to real visitors. Google uses a specific set called Core Web Vitals to evaluate user experience and factor it into search rankings. Understanding these metrics is the first step toward using website analytics to grow your business.
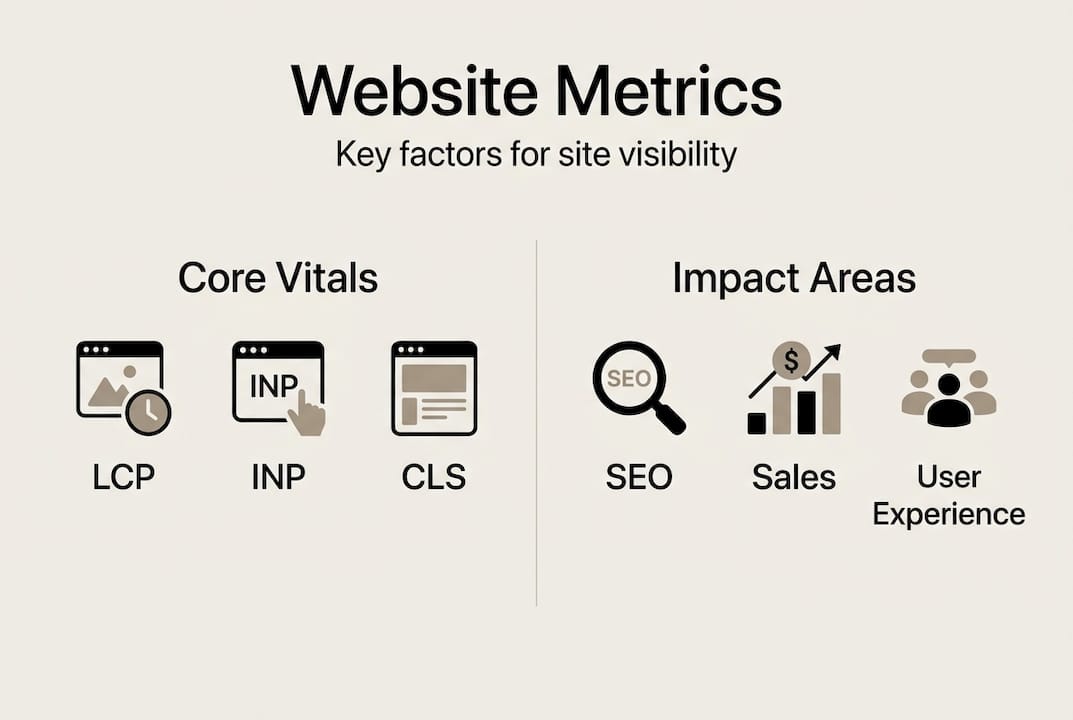
The three Core Web Vitals are:
- LCP (Largest Contentful Paint): Measures how long it takes for the biggest visible element on a page to load. Think of it as the moment your visitor sees the main content.
- INP (Interaction to Next Paint): Measures how quickly your page responds when a user clicks, taps, or types. A slow INP makes your site feel broken.
- CLS (Cumulative Layout Shift): Measures how much your page layout jumps around while loading. Unexpected shifts frustrate users and kill trust.
According to the Web Almanac, these Core Web Vitals are measured at the 75th percentile of real user experiences. That means your score reflects what 75% of your visitors actually experience, not just the best-case scenario.
| Metric | What it measures | Good threshold |
|---|---|---|
| LCP | Load speed of main content | ≤ 2.5 seconds |
| INP | Response time to user input | ≤ 200 milliseconds |
| CLS | Visual stability during load | ≤ 0.1 |
“A slow website isn’t just an inconvenience. It’s a conversion killer and an SEO liability.”
Understanding website speed’s impact on your rankings is critical. Google confirmed Core Web Vitals as ranking signals, meaning poor scores can push you down in search results even if your content is excellent. Poor metrics also increase bounce rates, which signals to Google that visitors aren’t finding value, compounding the SEO damage. You can start tracking digital marketing success by monitoring these three numbers regularly.
How site performance impacts SEO and sales
Now that you know the critical metrics, let’s connect the dots to real-world business outcomes: SEO performance and your bottom line.

Here’s the hard truth: over 60% of web traffic is mobile, yet mobile sites consistently lag behind desktops in Core Web Vitals scores. If your site loads slowly on a phone, you’re losing the majority of your potential customers before they even see your offer.
Faster websites deliver measurable business results:
- Lower bounce rates, meaning more visitors stay and explore
- Higher conversion rates, turning browsers into buyers
- Better SEO rankings, driving more organic traffic
- Stronger user trust, which supports repeat visits and referrals
The connection between website speed and sales is direct and well-documented. A one-second delay in page load time can reduce conversions by up to 7%. For a business doing $10,000 a month online, that’s $700 in lost revenue every single month from one second of lag.
“Core Web Vitals assessed at the 75th percentile means your worst-performing visitors define your score.”
Pro Tip: Don’t just look at your average score. Focus on the bottom 25% of user experiences, because those are the visitors most likely to leave and never come back. Fixing their experience is where you recover lost sales.
Only 48% of mobile sites pass all three Core Web Vitals. That means if you fix your mobile performance, you immediately outperform more than half your competition. Pairing performance improvements with affordable digital marketing strategies creates a compounding effect on your visibility. You can also explore specific tactics to increase website conversions once your technical foundation is solid.
A closer look at Core Web Vitals
With the business impact clear, it’s worth digging deeper into these essential metrics so you know exactly what needs fixing.
The industry standards are LCP ≤ 2.5 seconds, INP ≤ 200 milliseconds, and CLS ≤ 0.1. Here’s what commonly causes each one to fail for small businesses:
- LCP failures: Oversized, uncompressed images are the number one culprit. Slow hosting servers and render-blocking CSS also delay when your main content appears.
- INP failures: JavaScript-heavy single page apps are a major cause. Too many third-party scripts, like chat widgets and ad trackers, compete for processing power and slow response times.
- CLS failures: Images and ads without defined dimensions cause layout shifts. Fonts that load late and push text around are another common trigger.
| Metric | Common causes | Quick fix |
|---|---|---|
| LCP | Large images, slow server | Compress images, upgrade hosting |
| INP | JS bloat, third-party scripts | Defer scripts, reduce plugins |
| CLS | Missing image dimensions, late fonts | Set width/height on all media |
Mobile users face these problems more severely because their devices have less processing power and their networks are slower. A site that scores well on desktop can still fail badly on mobile, which is where most of your traffic lives. Use real-time website analytics to see how your mobile visitors are actually experiencing your site.
Pro Tip: Build in a buffer when setting your targets. Aim for LCP under 2 seconds and keep your total JavaScript under 300KB. This gives you room to add features later without immediately dropping into the “needs improvement” zone. The full Web Almanac report is a great reference for understanding where the industry stands.
Website performance monitoring tools compared
Armed with knowledge of what to measure, it’s time to pick the best tools for the job. Here’s how they stack up and what to use when.
The key distinction to understand is lab data versus field data. Lab data is collected in a controlled environment and is great for debugging specific issues. Field data, also called CrUX (Chrome User Experience Report), reflects what real users experience and is what Google uses for SEO rankings. Lab data helps debugging; field data determines your actual ranking impact.
| Tool | Data type | Best for |
|---|---|---|
| PageSpeed Insights | Lab + Field | Quick scan and SEO view |
| Lighthouse | Lab | Deep technical debugging |
| GTmetrix | Lab | Waterfall analysis |
| WebPageTest | Lab | Advanced testing scenarios |
| Pingdom | Lab | Simple speed checks |
| Google Search Console | Field | Monitoring real user CWV |
According to Pingdom’s speed test, these tools cover different needs from quick scans to deep dives. Here’s how to use them strategically:
- Use PageSpeed Insights first for a fast overview that combines lab scores with real user data
- Use Lighthouse when you need to trace exactly why a metric is failing
- Use Google Search Console for ongoing monitoring of your actual SEO-relevant scores
- Set up monthly checks at minimum, and always run a test after major site updates
Continuous monitoring is what separates businesses that maintain strong rankings from those that slip without noticing. Connect your monitoring routine to website analytics for growth so performance data informs your broader strategy. You should also integrate this into your tracking campaign performance workflow to catch regressions before they hurt your results.
How to improve website performance: best practices
With the right tools in hand, let’s move to practical steps your business can implement starting today to boost website performance.
Third-party scripts, oversized JS, and unoptimized images are the most common culprits behind poor scores. The good news is that many fixes are straightforward and don’t require a developer.
Quick wins you can do now:
- Compress all images using a tool like Squoosh or ShortPixel before uploading them
- Set explicit width and height attributes on every image and video element
- Enable browser caching so returning visitors load your site faster
- Remove unused plugins and third-party scripts that add weight without value
- Use a content delivery network (CDN) to serve files from servers closer to your visitors
Advanced improvements for bigger gains:
- Defer non-critical JavaScript so it loads after the main content appears
- Lazy-load images that are below the fold so they don’t slow initial load
- Preload your LCP image so the browser prioritizes it immediately
- Minimize CSS and remove unused styles to reduce render-blocking resources
Setting a performance budget keeps your site fast as it grows. A performance budget is a hard limit on resource sizes, for example keeping total JavaScript under 300KB and targeting LCP under 2 seconds. Review your Core Web Vitals tips regularly to stay current with best practices.
Pro Tip: Don’t chase a perfect 100 score. A score of 90 or above delivers real-world results for most businesses. Obsessing over the last few points often means diminishing returns. Focus your energy on the fixes that move the needle for actual visitors. Understanding why website speed matters helps you prioritize the right improvements, and aligning them with your marketing budget planning ensures you get the best return on every dollar spent.
Ready to turn performance into profit?
Improving your website performance metrics is one of the highest-leverage moves a small business can make. Faster load times, stable layouts, and responsive interactions directly translate into better rankings, lower bounce rates, and more sales.

At ibrand.media, we specialize in helping small and medium-sized businesses close the gap between where their website is and where it needs to be. From technical SEO audits to mobile-optimized web design and real-time performance tracking, we build the foundation your digital marketing needs to actually work. If you’re ready to stop guessing and start growing, we’ll put together a personalized plan built around your goals and your budget. Reach out today and let’s get your site performing at the level your business deserves.
Frequently asked questions
What is the most important website performance metric for small businesses?
LCP is a primary Core Web Vital because it measures how fast your main content loads, making it the metric most directly tied to first impressions, user experience, and SEO rankings.
How often should I check my website performance metrics?
Run checks at least monthly using PageSpeed Insights or GTmetrix, and always test after major site updates. Continuous monitoring prevents regressions that quietly damage your SEO and sales over time.
Why does my site score lower on mobile than desktop?
Mobile devices have less processing power and slower network connections, which amplifies every performance issue. Only 48% of mobile sites pass all three Core Web Vitals, so optimizing images and reducing scripts makes a significant difference.
What is a performance budget in website management?
A performance budget is a defined limit on page resources to keep your site fast. Common targets include keeping JavaScript under 300KB and LCP under 2 seconds. Performance budgets help you maintain good scores as your site grows and evolves.
Recommended
- Complete Guide to Why Website Speed Matters | Ibrandmedia
- Website Analytics: Driving Business Growth Online | Ibrandmedia
- Website Speed: Impact on Small Business Growth | Ibrandmedia
- Online Visibility: Driving Business Growth and Sales | Ibrandmedia
- Digitale Sichtbarkeit steigern Guide: Effizient zur Top-Präsenz
Recent Comments