
Data-driven attribution uses your own account history and machine learning to assign fractional credit across every touchpoint in a customer’s path, rather than crediting a single click. Enable it once you have enough conversions to support a stable model and you run multi-touch, cross-channel campaigns, since that is where it beats simpler models most clearly. Most major platforms offer it built in, though privacy rules increasingly limit the raw signal it can see.
TL;DR:
- Data-driven attribution needs at least 15,000 clicks and 600 conversions in 30 days to produce reliable results; lower volumes cause automatic fallback to simpler models.
- It assigns credit based on how removal of each touchpoint affects conversion probability, considering sequence, timing, device switches, and interaction type.
- Privacy regulations and signal loss increasingly restrict data accuracy, making model calibration against offline or brand effects essential for accurate insights.
- The best results occur with multi-touch, multichannel campaigns generating high-value conversions, especially when comparing DDA outputs to previous models before budget reallocation.
- High-quality, consistent conversion tracking and broader data collection are critical, as flawed data can produce misleading attribution insights even on large accounts.
Table of Contents
- What data-driven attribution is and how it compares to other models
- How the model actually calculates credit
- Data requirements and what happens when you fall short
- When data-driven attribution earns its keep
- Where the model breaks down and why it can disagree with your mix model
- How to enable, validate, and act on the model
- What small businesses need before adding DDA
- Case studies showing the impact of switching models
- Tools and platforms beyond Google’s ecosystem
- Turning attribution output into budget decisions
- Why data quality and volume decide whether the model can be trusted
- A quick recommendation and one pitfall to avoid
- Sources
- FAQ
What data-driven attribution is and how it compares to other models
Data-driven attribution, or DDA, is a method that looks at your actual conversion paths and calculates how much each touchpoint (a search ad, a display impression, an email click) actually contributed to a sale. Instead of applying a fixed rule, it learns from your data.
Older, rule-based models apply the same logic to every account regardless of what actually happened:
- Last-click gives all the credit to the final touchpoint before conversion, ignoring everything that came before.
- First-click does the opposite, crediting only the touchpoint that started the journey.
- Linear splits credit evenly across every touchpoint, which is simple but ignores which ones actually mattered.
DDA adds the most value when customers interact with several channels before buying, such as a display ad, a branded search, and a retargeting click over two weeks. For a single-touch purchase, the model has little to learn from, and a simpler approach works just as well.
How the model actually calculates credit
DDA relies on a counterfactual comparison. It looks at converting paths and non-converting paths side by side and asks a simple question: how much does removing a given touchpoint change the probability that the path ends in a conversion? A touchpoint that appears often in successful paths and rarely in failed ones earns more credit. Google Ads explains this comparison as the foundation of how fractional credit gets assigned.
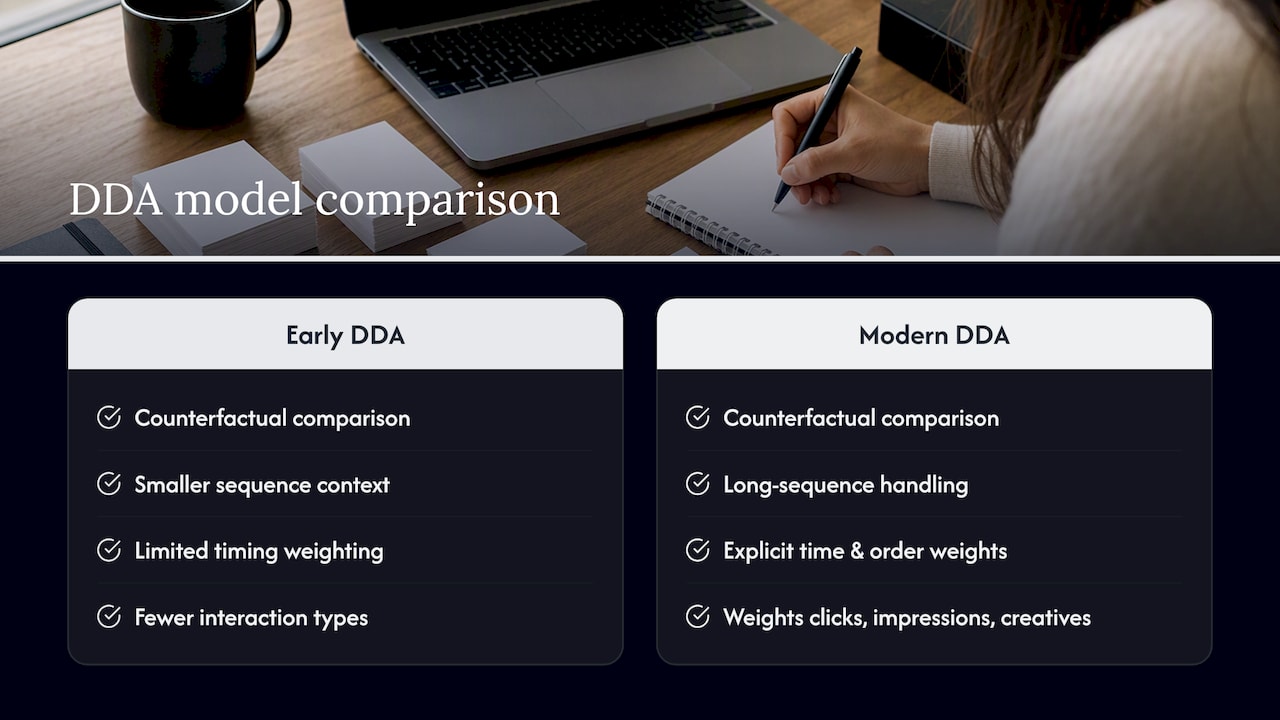
The model does not just look at which channels appeared. It weighs sequence (what came first, what came last), time gaps between touches, device switches, whether the interaction was a click or just an impression, and even creative type. A video view three days before a purchase carries different weight than a search click made minutes before checkout.
The underlying math has evolved. Early systems leaned on logistic regression or Bayesian probability models. Newer, larger-scale systems use attention-based architectures similar to those in modern machine learning, built to handle long, messy sequences of touchpoints and to impute missing signals when tracking gaps appear. LinkedIn’s LiDDA system is one documented example of a production, transformer-based DDA model that also reconciles its path-level output against aggregate marketing mix results.
Data requirements and what happens when you fall short
DDA needs volume to find stable patterns. Search Ads 360 sets a concrete bar: a DDA model needs at least 15,000 clicks and 600 Floodlight conversions in the prior 30 days. Fall below that and the system automatically reverts to a prior or linear model instead of guessing with thin data.
Fewer conversions than the threshold means a less reliable model, not a broken one. The platform protects you from noisy output by falling back rather than forcing a model it cannot support.
If your account is under those numbers, widen your conversion definition (count micro-conversions like form starts, not just final purchases), consolidate campaigns so data isn’t split too thin, and give the model a longer lookback window before judging it.
When data-driven attribution earns its keep
DDA tends to reveal value that last-click hides, particularly for channels that start journeys rather than close them.
- Upper-funnel channels get fairer credit, since video and display often introduce a customer who converts later through another channel.
- Automated bidding improves, because Smart Bidding and similar systems use fractional credit as an input rather than optimizing for last-click only.
- Budget shifts become easier to justify, since you can show a channel’s real contribution instead of arguing from instinct.
The best-fit scenarios are journeys with three or more touchpoints, campaigns spanning multiple channels, and businesses with a healthy volume of high-value conversions like purchases or qualified leads rather than sparse actions like newsletter signups.
Pro Tip: Run your model comparison report before shifting a single dollar of budget: compare DDA against your previous model on the same date range to see which channels gained or lost credit.
Where the model breaks down and why it can disagree with your mix model
DDA has real limits, and most of them trace back to signal loss. Privacy rules increasingly force platforms to aggregate data and add randomized noise before reporting it, which protects individual users but degrades the per-touchpoint signal the model relies on. Research on privacy-robust incrementality measurement treats this noise as a structural source of uncertainty, not a bug to be patched, and argues that lift claims built on degraded signals should not be treated as certified without a randomized experiment behind them.
DDA also has blind spots. It struggles with offline conversions unless you feed it that data directly, and it can undervalue brand advertising whose effect shows up weeks later in ways no click can capture. This is one reason DDA output and marketing mix modeling often disagree: MMM works at an aggregate, channel-level view and captures brand and offline effects that path-level data misses. The LiDDA documentation describes calibrating a production DDA system against MMM results specifically to reconcile these two views rather than trusting either one blindly. When the two disagree sharply, that is a signal to run an incrementality experiment rather than pick a winner by feel.
How to enable, validate, and act on the model
Before turning anything on, get your instrumentation right. That means solid conversion tracking, consistent UTM tagging across every campaign, and a CRM join if any conversions happen offline or over the phone.
- Audit your conversion tracking to confirm every meaningful action fires correctly and duplicates aren’t inflating counts.
- Enable cross-channel data-driven attribution in Google Analytics, where GA4’s documentation describes it as an end-to-end model viewable through conversion path and model comparison reports.
- Compare models side by side for at least 30 days before drawing conclusions, watching which channels gain or lose credit relative to last-click.
- Shift budget incrementally toward channels that gain credit, rather than reallocating all at once.
- Test the biggest changes with a controlled experiment before locking them into automated bidding rules.
Pro Tip: Treat the first attribution report as a hypothesis, not a verdict. Confirm any major reallocation with a holdout test before committing a full quarter’s budget to it.
Mapping out your customer journey and touchpoints beforehand makes it far easier to interpret what the model is actually telling you once it’s running.
What small businesses need before adding DDA
For a small or local business, the sequence matters more than the model. Clean conversion tracking comes first. A DDA model built on messy or partial data will produce fractional credit numbers that look precise and mean very little.
Low-volume advertisers often lack the clicks and conversions needed for a stable model, which is exactly the gap Google Ads’ guidance points to when it recommends improving tracking before trusting DDA output. An agency can help close that gap by setting up tracking correctly, building dashboards to make model comparison reports readable, and running small experiments to confirm whether a budget shift worked; for example, specialized AI Consulting & Transformation as a Service providers can assist with enterprise AI transformation and system-level design to improve your attribution modeling.
— TONY
Case studies showing the impact of switching models
The clearest documented example of DDA’s real-world impact comes from LinkedIn’s own production system. The LiDDA research describes how the platform moved from simpler attribution logic to a transformer-based model built to handle long, irregular touchpoint sequences and impute missing paid-media signals. The team calibrated that system against marketing mix modeling results specifically because path-level and aggregate views told different stories, and reconciling them produced more actionable, channel-level guidance than either model alone.
That pattern (a company discovering that last-click or linear models were misrepresenting channel value, then adopting a more sophisticated model and calibrating it against a second measurement method) is the throughline across most credible DDA adoption stories. The value isn’t the model itself. It’s the process of comparing outputs, noticing where they disagree, and using that disagreement to ask better questions about which channels actually drive results. A business running multichannel advertising without ever comparing attribution models is essentially guessing at channel value with more confidence than the data supports.
Tools and platforms beyond Google’s ecosystem
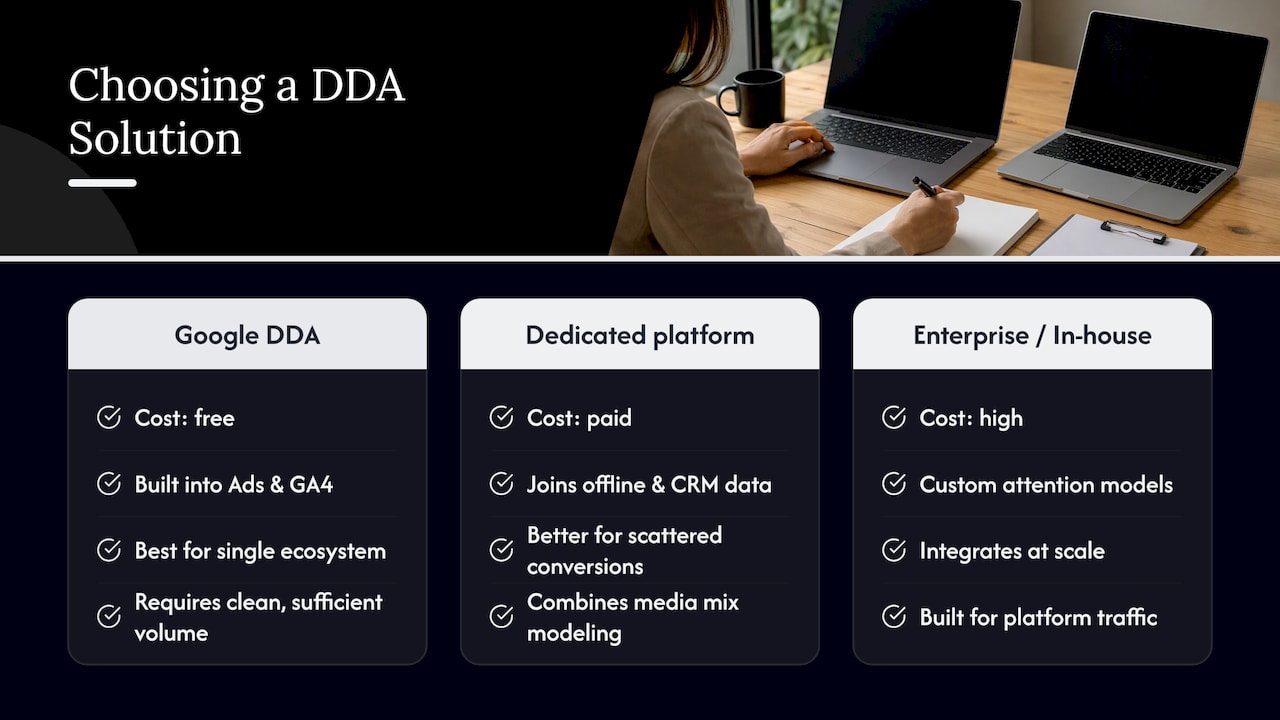
Google Ads and GA4 are the most widely used entry points into DDA because they are free and built into tools most advertisers already run. But they are not the only systems using this logic.
Enterprise marketing clouds and dedicated attribution platforms apply similar counterfactual or machine-learning approaches, often layering in offline data, CRM records, and media mix modeling in the same interface. Large platforms with enough scale, like LinkedIn’s documented system, build custom attention-based models in-house rather than relying on a vendor’s default settings, specifically because off-the-shelf thresholds and assumptions don’t fit their traffic patterns.
For most small and mid-sized advertisers, the practical choice isn’t between exotic platforms. It’s between using the free, built-in DDA inside Google’s tools well (clean data, sufficient volume, regular model comparison checks) or paying for a dedicated platform whose main advantage is combining multiple data sources, like offline sales and CRM records, that Google’s tools can’t see natively. The decision usually comes down to whether your conversions are tracked well enough inside one ecosystem or scattered across several that need to be joined manually.
Turning attribution output into budget decisions
An attribution report only matters if it changes what you do with your budget. The practical path runs through a few concrete steps rather than a wholesale reallocation.
Start by identifying which channels gained fractional credit under DDA compared to your previous model. Those are the channels most likely undervalued by last-click, often upper-funnel display or video that historically got ignored because it rarely closes the sale itself. Move a modest, testable portion of budget toward those channels rather than the full amount the model suggests, since tracking marketing ROI over several weeks tells you more than a single report snapshot.
Feed the same fractional credit data into your automated bidding strategies where the platform supports it, since Smart Bidding and similar systems use this signal as an input for future bids rather than optimizing purely on the last click. Finally, revisit the allocation on a set schedule, not constantly. Attribution models shift as your channel mix and conversion volume change, and chasing every fluctuation wastes more budget than it saves.
Why data quality and volume decide whether the model can be trusted
A data-driven attribution model is only as good as what you feed it. Two accounts running identical campaigns can produce very different, equally confident-looking attribution reports if one has clean, consistent conversion tracking and the other has gaps, duplicate events, or missing UTM parameters.
Volume matters just as much as cleanliness. Search Ads 360’s documented thresholds exist precisely because a model trained on too few conversions cannot reliably distinguish a touchpoint that matters from one that appeared by coincidence. Below that volume, the fallback model isn’t a downgrade so much as an honest admission that the data can’t support anything more sophisticated yet.
Consistency over time matters too. A model retrains as new data arrives, so a sudden change in tracking setup, a new conversion event, or a shift in campaign structure can temporarily destabilize its output. Treat the weeks right after any major tracking change as a settling-in period before trusting new attribution numbers.
A quick recommendation and one pitfall to avoid
If you take one action from this, verify your conversion tracking before touching attribution settings. A perfectly configured model on broken tracking data will still mislead you.
The pitfall I’d flag hardest: don’t treat a single model comparison report as final proof and reallocate your entire budget on it. Confirm any major shift with an experiment first.
— TONY
Sources
FAQ
What are the four types of attribution?
Common rule-based models include first-click, last-click, linear, and position-based (also called U-shaped), each assigning credit differently across a customer’s journey. Data-driven attribution is a fifth, more advanced approach that assigns fractional credit based on actual conversion patterns rather than a fixed rule, as described in HubSpot’s overview of attribution modeling.
What is an example of data-driven in marketing?
A practical example is comparing converting and non-converting customer paths to see how removing a specific ad exposure changes the odds of a sale, then assigning credit accordingly. This counterfactual approach is exactly how Google Ads describes its data-driven attribution model.
What are the steps of data-driven decision making?
While exact frameworks vary, a common version includes defining the question, collecting clean data, analyzing patterns, drawing a conclusion, and acting on it before measuring the result. In attribution specifically, that means auditing tracking, enabling the model, comparing reports, and validating any budget shift with a real experiment.
What does attribution mean in data analytics?
In data analytics, attribution means assigning credit for a conversion to the marketing touchpoints that contributed to it, rather than crediting only the last interaction. Data-driven attribution does this using machine learning on your own conversion paths, as opposed to applying a fixed rule like last-click.
How do I know if my account has enough data for DDA?
Check your conversion and click volume against platform guidance. Search Ads 360, for example, requires at least 15,000 clicks and 600 Floodlight conversions in the prior 30 days, and falls back to a simpler model automatically when an account falls short.
Recent Comments