
User engagement is the quality of connection between a person and a digital product, expressed through what they do (behavioral), what they think (cognitive), and what they feel (affective) during and after an interaction. That three-part definition, grounded in O’Brien & Toms’ conceptual framework, is what separates a rigorous engagement strategy from one that just tracks page views and calls it a day.
Why does it matter? Because engagement is the leading indicator for retention, monetization, and product decisions. A product team that understands which dimension of engagement is slipping can fix the right thing. One that only watches a single number usually fixes the wrong thing.
Three things to keep in mind before you read further:
- Engagement is multi-dimensional. No single metric captures it. DAU/MAU, session duration, and events per session each measure a different slice.
- Analytics metrics are proxies. Tools like Google Analytics and Amplitude surface behavioral signals, not the full picture.
- Metrics must connect to product goals. A high DAU/MAU ratio means nothing if users never complete the core task your product exists to support.
Table of Contents
- What Does User Engagement Actually Include?
- Why Engagement Belongs on Your Product Roadmap
- What Are the Core KPIs for Measuring Engagement?
- How Should You Measure Engagement?
- How Do You Define Engagement for Your Specific Product?
- How Can You Improve Engagement?
- What Are the Most Common Engagement Measurement Pitfalls?
- What Do Engagement Benchmarks Actually Look Like?
- Research Foundations and Measurement Methodology
- Key Takeaways
- Engagement Governance Is a Team Sport
- How Ibrand Helps You Turn Engagement Data Into Results
- Useful Sources
- FAQ
What Does User Engagement Actually Include?
The O’Brien & Toms framework describes engagement as a multi-dimensional quality of user experience, not a single event. It has three distinct components, and each one requires a different measurement approach.
The three core dimensions:
- Behavioral: What users physically do. Clicks, scrolls, events fired, features used, content shared. This is the dimension most analytics tools measure directly.
- Cognitive: How much mental attention and absorption the experience demands. A user who reads every word of a long article is cognitively engaged; one who skims the headline and bounces is not, even if both sessions look identical in a raw pageview count.
- Affective: The emotional response. Positive affect, pleasure, curiosity, and a sense of novelty all contribute. A user who feels delighted by an interaction is more likely to return than one who feels neutral.
These dimensions do not operate in isolation. An empirical model of interactive media found that physical interaction and interface assessment together predict cognitive absorption, which in turn predicts sharing behavior. In other words, the behavioral layer feeds the cognitive layer, which feeds the affective layer.
Engagement is also cyclical, not linear. O’Brien & Toms describe four stages: point of engagement (the initial hook), sustained engagement (the user stays and deepens), disengagement (attention drifts or the session ends), and re-engagement (the user returns). Designing for re-engagement is just as important as designing for the initial hook, and Lalmas, O’Brien, and colleagues specifically call out novelty, personalization, and social features as the most reliable levers for pulling users back into the cycle.
One more thing worth stating plainly: engagement is an inferred construct. You cannot observe it directly. You infer it from behavioral data, then validate that inference with self-report surveys or qualitative observation. A systematic review of 241 HCI research articles found no universally accepted definition of user engagement, precisely because different research contexts operationalize it differently. That is not a flaw in the concept. It is a signal that your team needs to define it explicitly for your product.
Why Engagement Belongs on Your Product Roadmap
Engagement signals are the earliest warning system a product team has. By the time churn shows up in revenue data, the engagement decline that caused it happened weeks or months earlier.
Here is how specific signals map to outcomes:
- Session length and return frequency predict lifetime value. Users who return often and stay longer generate more revenue, whether through subscriptions, ads, or in-app purchases.
- Feature adoption and events per session reveal whether users are getting value from the product’s core functionality. Low adoption of a key feature is a UX problem before it becomes a retention problem.
- Social sharing and referral behavior are affective signals. Users who share are not just behaviorally engaged; they feel something positive enough to stake their reputation on recommending the product.
- Churn rate is the lagging indicator that engagement metrics help you predict and prevent.
Understanding why customer engagement matters goes beyond retention. Engaged users are cheaper to retain than new users are to acquire, and they generate referral traffic that compounds over time.
Stakeholder-level benefits by function:
- Product teams: Engagement data prioritizes feature investment. If users are cognitively disengaged during onboarding, that is where engineering time goes next.
- Marketing teams: Engagement signals identify which content and channels drive high-quality users, not just high-volume traffic.
- Customer success teams: Low engagement scores in B2B SaaS are the clearest early indicator of a renewal at risk.
One caveat worth naming: not all engagement is beneficial. Designs that exploit compulsive behavior patterns may generate high session frequency while degrading user wellbeing. The goal is engagement that creates genuine value for the user, not just activity that flatters a dashboard.
What Are the Core KPIs for Measuring Engagement?
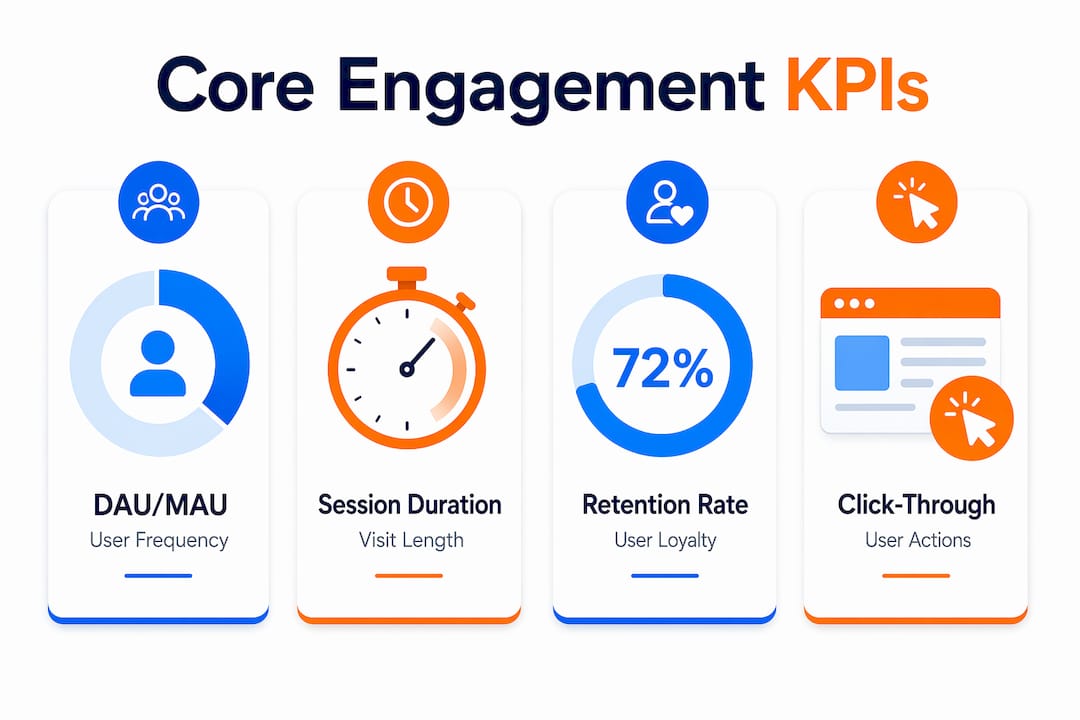
The table below covers the KPIs most product and analytics teams rely on. Each one measures a different aspect of the engagement construct, which is why using only one is almost always misleading.
| KPI | Formula | What It Measures | When to Use It |
|---|---|---|---|
| DAU | Count of unique users active in a day | Daily reach and habit formation | Consumer apps with daily use cases |
| MAU | Count of unique users active in a month | Monthly reach and baseline retention | Any product; baseline for stickiness |
| DAU/MAU (Stickiness) | DAU ÷ MAU × 100 | How often monthly users return daily | Comparing engagement depth over time |
| Session duration | Total session time ÷ session count | Time investment per visit | Content, media, and productivity apps |
| Retention rate | Users retained in cohort ÷ original cohort size × 100 | Cohort-level loyalty over time | All products; core health metric |
| Churn rate | Users lost in period ÷ users at start × 100 | Rate of disengagement | Subscription and SaaS products |
| Events per session | Total events ÷ total sessions | Behavioral depth per visit | Feature adoption, onboarding analysis |
| Conversion rate | Conversions ÷ sessions × 100 | Goal completion | E-commerce, lead gen, activation flows |
| Time-in-focus (GA4) | Time page/screen is in active focus | Narrow attention signal | Web analytics; use with caution (see below) |
Worked example: calculating stickiness. Suppose your app has 10,000 daily active users and 50,000 monthly active users. DAU/MAU = 10,000 ÷ 50,000 × 100 is an example of calculating stickiness, which indicates the proportion of monthly users opening the app daily, varying by product context. For a social or messaging app, that would be low. For a quarterly tax tool, it might be exactly right. Context determines what the number means.
On GA4’s time-in-focus: Google Analytics 4 defines “user engagement” as the time a page or app screen spends in active focus, which is a narrow, implementation-level metric. It is not the same as the multi-dimensional engagement construct product teams care about. Treating GA4’s engagement metric as your primary engagement signal will undercount users who are cognitively absorbed but not actively clicking, and overcount users who leave a tab open while doing something else.
How Should You Measure Engagement?
Three measurement families cover the full construct. Each has trade-offs, and the best measurement plans combine at least two.
Behavioral analytics
Event-based tracking captures what users do. Every click, screen view, feature interaction, and session boundary is a data point. This is the foundation of any engagement measurement program.
Best tools:
- Google Analytics (GA4): Strong for web traffic, time-in-focus, and conversion funnels. Free tier covers most small-to-mid-size products.
- Amplitude: Purpose-built for product analytics. Cohort analysis, retention charts, and event-based funnels are its core strengths. Better than GA4 for understanding behavioral sequences and feature adoption.
Pros: High volume, continuous, low marginal cost once instrumented. Cons: Measures behavior, not intent or feeling. A user who clicks repeatedly may be frustrated, not engaged.
Self-report surveys

The User Engagement Scale (UES) and its short form are validated instruments that capture affective and attention-related dimensions analytics cannot reach. The UES measures focused attention, aesthetic appeal, novelty, perceived usability, felt involvement, and endurability. NPS-style surveys capture a simpler affective signal: would you recommend this?
Pros: Captures cognitive and affective dimensions directly. Cons: Requires sampling, response rates vary, and survey fatigue is real in high-frequency products.
Qualitative methods
Session replay tools, usability interviews, and contextual observation fill the gap between what users do and why they do it. A session replay showing repeated rage-clicks on a non-interactive element tells you something a retention chart never will.

Pros: Rich, explanatory data. Cons: Not scalable; requires analyst time to synthesize.
Implementation checklist for the first 30 days:
- Audit your current event taxonomy. Are key actions consistently named and fired?
- Define your cohort structure. What constitutes “Day 1” for a new user?
- Instrument three to five core behavioral events tied to your product’s primary value moment.
- Set up a retention cohort chart in Amplitude or GA4.
- Deploy a short UES-SF survey to a sample of active users.
For days 31–90:
- Analyze first-week retention by acquisition channel and onboarding path.
- Identify the behavioral event most correlated with 30-day retention (your “activation metric”).
- Run your first A/B test on the onboarding flow, using retention as the primary metric.
- Review qualitative session replays for the top drop-off point in your core flow.
Pro Tip: Pair every behavioral metric with at least one qualitative signal before drawing conclusions. High events-per-session with low task completion usually means users are lost, not engaged. Use website analytics to surface the behavioral pattern, then use session replay or interviews to understand it.
How Do You Define Engagement for Your Specific Product?
The biggest mistake teams make is borrowing someone else’s engagement definition. A social feed and a B2B dashboard have almost nothing in common when it comes to what “good engagement” looks like.
The engagement definition template:
- Product goal: What outcome does this product exist to create for the user?
- Engaged behavior definition: What specific action(s) indicate a user is getting that value?
- Primary KPI: The single metric most directly tied to that behavior.
- Secondary KPIs: Two to three supporting metrics that provide context.
- Measurement methods: Behavioral analytics, survey, qualitative, or a combination.
- Target value: What does “good” look like for this product and cohort?
- Owner: Which team or individual is accountable for this metric?
- Experiment plan: What is the next hypothesis you will test to move this metric?
Example 1: Consumer social feed app
- Product goal: Help users stay connected with their network daily.
- Engaged behavior: Opening the app and interacting with at least one post.
- Primary KPI: DAU/MAU (stickiness).
- Secondary KPIs: Events per session, 7-day retention.
- Measurement: Amplitude for cohort retention; UES-SF survey monthly.
- Target: DAU/MAU above 30%.
- Owner: Product manager, growth team.
- Experiment plan: Test progressive onboarding that surfaces the social graph faster.
Example 2: B2B SaaS dashboard
- Product goal: Help analysts complete their weekly reporting tasks faster.
- Engaged behavior: Completing a report export within a session.
- Primary KPI: Task completion rate (report exports per active user per week).
- Secondary KPIs: Session duration, 30-day retention.
- Measurement: Amplitude event tracking; NPS survey at 30-day mark.
- Target: Task completion rate above 60% for active users.
- Owner: Customer success lead, product manager.
- Experiment plan: Test a guided first-run experience for new dashboard users.
Governance checklist for this week:
- Write a one-page data dictionary defining every event name and its trigger condition.
- Confirm that your event taxonomy is consistent across platforms (web, iOS, Android).
- Identify one guardrail metric to detect fake engagement (e.g., task success rate alongside session frequency).
- Schedule a monthly engagement review with product, analytics, and customer success.
A CHI 2025 systematic review recommends that teams formally declare the dimension they are optimizing, the operational KPI and its formula, the primary evidence sources, and a guardrail metric. That four-part declaration is the governance minimum.
How Can You Improve Engagement?
Tactics work when they target the right dimension. The table below maps common interventions to the engagement dimension they primarily affect and the metric you should use to measure impact.
| Tactic | Target Dimension | Primary Measurement |
|---|---|---|
| Progressive onboarding | Behavioral + cognitive | First-week retention, activation rate |
| Personalized content feed | Affective + behavioral | Events per session, DAU/MAU |
| Push/email re-engagement | Behavioral | 7-day re-engagement rate |
| Social features (likes, comments) | Affective + behavioral | Sharing events, return frequency |
| In-app tooltips and guidance | Cognitive | Task completion rate, feature adoption |
| Novelty features and updates | Affective + cognitive | Session depth post-release |
| Reduced friction in core flow | Behavioral | Conversion rate, drop-off reduction |
Personalized marketing strategies consistently outperform generic content for affective engagement because they signal to the user that the product understands them. That feeling of being understood is itself an affective engagement driver.
Experiment design guidance:
Before you run any engagement experiment, define three things: the primary metric (what you are trying to move), the guardrail metrics (what you cannot afford to break), and the minimum detectable effect (how big a change you need to see before the result is meaningful). Without all three, you will either ship changes that hurt users or kill changes that would have helped.
Pro Tip: Avoid running engagement experiments during major seasonal events or product launches. External factors inflate or deflate engagement independently of your change, making attribution nearly impossible. Practitioner guidance specifically warns against attributing behavior changes to product changes when external factors are present.
For prioritization, start with low-effort, high-impact interventions: fixing a broken onboarding step costs less than building a new feature and often moves retention more. Personalization is high-impact but high-effort; save it for after you have validated the core engagement loop.
What Are the Most Common Engagement Measurement Pitfalls?
High numbers on a dashboard are not the same as high engagement. These are the pitfalls that cost teams the most time and credibility.
- Metrics-as-goals: When a team optimizes directly for DAU, they often inflate it through notifications or dark patterns. The metric goes up; actual user value does not. Fix: always pair a primary engagement metric with a value metric (task completion, satisfaction score).
- Confusing frequency with value: A user who opens an app ten times a day to fix a recurring error is not engaged; they are frustrated. An empirical study of interactive media found that high interaction frequency without corresponding task completion is a signal of poor UX, not strong engagement. Fix: validate frequency signals with task-success or satisfaction data.
- Ignoring cohort behavior: Aggregate metrics hide the fact that new users behave very differently from power users. A rising average session duration might mean power users are going deeper while new users are churning faster. Fix: always segment by cohort age.
- Sampling bias in surveys: If you only survey users who respond to in-app prompts, you are hearing from your most engaged users. Fix: use stratified sampling across engagement tiers.
- Confounding marketing effects: A spike in DAU after a paid campaign is not a product engagement improvement. Fix: segment organic vs. paid cohorts before drawing conclusions about product changes.
- Treating GA4’s engagement metric as the full picture: GA4’s time-in-focus definition is a narrow technical signal. Document it as such in your measurement plan and map it explicitly to your strategic KPIs.
Pro Tip: To spot fake engagement in cohort charts, look for a sharp spike in Day 1 activity followed by a steep drop at Day 3 or Day 7. That pattern usually means a notification or incentive drove the initial action, not genuine product value. Real engagement curves flatten gradually, not cliff-drop.
What Do Engagement Benchmarks Actually Look Like?
Benchmarks are directional guides, not targets. A DAU/MAU ratio that may be a sign of health for a messaging app could be inappropriate or less meaningful for other product types like quarterly financial planning tools. Use benchmarks to calibrate your intuition, not to set your goals.
Rough directional ranges by product type:
- Consumer social and messaging apps: DAU/MAU ratios above 50% are considered strong; below 20% suggests a habit-formation problem.
- Consumer content and media apps: Session durations of 5–15 minutes per visit are typical; below 2 minutes usually signals a content-relevance issue.
- B2B SaaS tools: Weekly active user rates and task completion rates matter more than daily stickiness. A 60–70% monthly retention rate is a reasonable baseline for a well-adopted tool.
- E-commerce: Conversion rates and return visit frequency are the primary engagement signals; session depth (pages per session) is a secondary indicator.
Mini example 1: Consumer social feed. A team noticed their DAU/MAU had plateaued at 18%. They ran a progressive onboarding experiment that surfaced a user’s social connections within the first session. DAU/MAU climbed to 27% over eight weeks. The behavioral change (seeing familiar faces immediately) drove the affective response (feeling connected) that made daily return worthwhile.
Mini example 2: B2B analytics dashboard. A team saw average session duration drop 30% after a UI redesign. Their first instinct was to revert. Before doing so, they checked task completion rate, which had risen from 44% to 61%. Users were completing their core task faster and leaving. Shorter sessions meant better engagement quality, not worse. The redesign shipped.
These examples illustrate why benchmarks must always be read alongside the product’s specific engagement definition. The number alone tells you almost nothing.
Research Foundations and Measurement Methodology
Solid engagement measurement rests on four methodological principles: operationalization (defining exactly what you are measuring), validity (measuring what you intend to measure), reliability (getting consistent results across time and contexts), and triangulation (combining behavioral and self-report data to cross-validate findings).
The academic foundation for modern engagement measurement comes primarily from O’Brien & Toms’ 2008 conceptual framework, the User Engagement Scale developed by O’Brien and colleagues, and a body of HCI systematic reviews that have mapped how the field has operationalized the construct across hundreds of studies. A 2018 HCI systematic review spanning 351 articles found that engagement research uses diverse theoretical frameworks and measurement approaches, reinforcing the need for product-specific definitions rather than borrowed ones.
Key sources for further reading:
- O’Brien & Toms (2008) conceptual framework: the foundational definition of engagement as a multi-dimensional construct.
- The UES and UES-SF: validated survey instruments for affective and attention dimensions.
- CHI 2025 systematic review of 241 articles: the most current map of how HCI research defines and measures engagement.
- GA4 engagement documentation: the authoritative source for understanding what GA4’s metric actually measures.
- Amplitude product analytics guides: practitioner-level guidance on cohort analysis and event taxonomy.
When your product’s engagement questions go beyond what standard analytics can answer, consider commissioning a formal usability study or partnering with an HCI researcher. The investment pays off when you need to validate a new engagement construct or justify a major product direction to stakeholders.
Key Takeaways
User engagement is a multi-dimensional construct requiring behavioral, cognitive, and affective measurement, and no single KPI captures all three dimensions reliably.
| Point | Details |
|---|---|
| Three-part definition | Engagement spans behavioral (actions), cognitive (attention), and affective (emotion) dimensions. |
| Metrics are proxies | DAU/MAU, session duration, and events per session each measure one slice; combine them with surveys. |
| GA4 is narrow | GA4’s time-in-focus metric is implementation-specific, not a full engagement measure; document the distinction. |
| Define it for your product | Use the eight-field template to declare your engaged behavior, primary KPI, target, and guardrail metric. |
| Ibrand can operationalize it | Ibrand helps teams instrument events, set up analytics, and connect engagement signals to business outcomes. |
Engagement Governance Is a Team Sport
Most engagement failures are not measurement failures. They are ownership failures. A team that has no shared definition of what “engaged” means will optimize for different things in different quarters, and the metrics will reflect that incoherence.
The most durable engagement programs I have seen share one trait: a written engagement definition that lives in the product brief, not just in someone’s head. It names the dimension, the KPI, the formula, the measurement method, and the guardrail. It gets reviewed quarterly. It has a named owner.
Cross-functional ownership matters too. Product owns the behavioral definition. Analytics owns the instrumentation. Customer success owns the qualitative signal. Marketing owns the acquisition-to-engagement handoff. When those four functions share a measurement cadence, engagement data actually drives decisions instead of sitting in a dashboard nobody reads.
How Ibrand Helps You Turn Engagement Data Into Results
Most product teams have the data. What they lack is the infrastructure to act on it consistently. Ibrand works with small and mid-size businesses to build the analytics foundation that connects engagement signals to real business outcomes: event instrumentation, GA4 and Amplitude setup, onboarding flow design, and A/B testing support.
The gap between “we track sessions” and “we know which behavior predicts 90-day retention” is usually a matter of weeks of focused setup work, not months of enterprise consulting. Ibrand’s website optimization services are built for teams that need that foundation without the overhead of a full-time analytics hire.
Relevant services:
- Event taxonomy design and analytics platform configuration
- Onboarding flow audit and redesign
- Engagement KPI dashboard setup with guardrail metrics
- Experiment design and A/B testing support
Ready to build an engagement measurement program that actually informs decisions? Get in touch with Ibrand to start with a diagnostics review of your current analytics setup.
Useful Sources
The sources below underpin the definitions, frameworks, and measurement guidance in this article. Each annotation explains what the source contributes.
- O’Brien & Toms (2008): What is user engagement? A conceptual framework — The foundational paper defining engagement as a multi-dimensional construct with behavioral, cognitive, and affective components and a four-stage cyclical model.
- Lalmas, O’Brien et al.: Engagement as a multifaceted phenomenon — Extends the O’Brien & Toms framework with practitioner guidance on re-engagement levers including novelty, personalization, and social features.
- CHI 2025 systematic review of 241 UE research articles — The most current academic map of how engagement is defined and operationalized across HCI research; supports the case for product-specific definitions.
- HCI systematic review: Engagement in HCI (351 articles) — Broader review covering engagement theory, measurement diversity, and design strategies; useful for teams building formal measurement programs.
- Refined User Engagement Scale (UES) and UES-SF — The validated survey instrument for measuring affective and attention dimensions; includes the short form for practical deployment.
- Empirical model of user engagement with interactive media — Shows how physical interaction and interface assessment predict cognitive absorption and sharing behavior; supports the multi-attribute measurement approach.
- Practitioner guidance on engagement metrics and experimentation — Cautions against treating metrics as proof of value; recommends pairing metrics with A/B tests and guarding against external confounds.
- Google Analytics 4: User engagement definition — The authoritative source for GA4’s time-in-focus definition; essential for understanding the gap between tool-level and strategic engagement metrics.
- Gainsight: User engagement metrics guide — Practitioner-level guide covering DAU/MAU, stickiness, cohort retention, and implementation steps for engagement KPIs.
- CHI 2025: Definitions and measurement inconsistencies in UE — Companion paper to the systematic review; makes the case for product-specific operational definitions over borrowed categorical labels.
FAQ
What are the main types of user engagement?
Engagement has three core types: behavioral (actions like clicks and feature use), cognitive (attention and mental absorption), and affective (emotional response like pleasure or curiosity). Most analytics tools measure only the behavioral type directly.
What is a good KPI for engagement?
The most widely used engagement KPI is the DAU/MAU ratio, which measures how often monthly users return on a daily basis. For B2B products, task completion rate is often more meaningful than frequency-based metrics.
What are the stages of user engagement?
O’Brien & Toms describe four stages: point of engagement (initial hook), sustained engagement (the user deepens their interaction), disengagement (attention fades or the session ends), and re-engagement (the user returns). Designing for all four stages, not just the first, is what separates strong engagement programs from weak ones.
What is another word for user engagement?
“User involvement” and “user interaction” are common alternatives, though neither fully captures the multi-dimensional construct. In academic HCI literature, “user experience quality” is sometimes used as a broader synonym. In product analytics, “stickiness” refers specifically to the behavioral frequency dimension.
Recent Comments