
If your Google Ads show a low Quality Score, start by checking the three component statuses: expected CTR, ad relevance, and landing page experience. Then run two immediate fixes: split mismatched keywords into tighter ad groups, and adjust the worst-matching ad or landing page. Treat the number as a diagnostic pointer toward conversion and cost problems, not a target to chase for its own sake.
TL;DR:
- Focus on fixing mismatched keywords by creating smaller, tightly themed ad groups to improve ad relevance and expected CTR.
- Prioritize matching landing pages to ad promises with fast load speeds and mobile-friendly design to enhance landing page experience.
- Use component status indicators to diagnose issues for high-traffic keywords, avoiding unnecessary changes if data is insufficient or if issues stem from account structure.
- Make quick, targeted improvements like rewriting ad copy, adjusting ad targeting, and building specific landing pages for themes to see faster results.
- Avoid wasting effort on adding extensions or chasing perfect scores, and instead monitor conversion metrics to assess real account performance.
Table of Contents
- What Quality Score actually tells you
- The three components and where to find them
- Quick diagnosis checklist for low Quality Score
- Fixing expected CTR and ad relevance with better ads
- Fixing landing page experience without a site rebuild
- Prioritizing fixes: a 30-day testing plan
- What won’t move the needle
- A marketer’s view on fixing Quality Score fast
- How we help fix low Quality Score accounts
- FAQ
- Sources
What Quality Score actually tells you
Quality Score is Google’s shorthand for how well your keyword, ad, and landing page match what a searcher wants at the moment of the auction. A low number is a symptom, not the disease itself: it flags where your account’s experience is weakest so you know where to spend your limited time.
Google’s own guidance frames this clearly: Quality Score should be used as a diagnostic indicator, and business results such as conversion rate matter more than chasing a top numeric score, according to Google’s ad quality guidance. Watching the number rise without watching cost per conversion fall is a common trap for small teams.
The component statuses behind the score give you the real work list:
- “Below average” on expected CTR usually points to weak or mismatched ad copy.
- “Below average” on ad relevance usually means your keywords and ad text are not speaking the same language.
- “Below average” on landing page experience usually means the page itself is slow, irrelevant, or hard to use.
Use these three signals to decide what to fix first, not as a scoreboard to refresh every morning.
The three components and where to find them
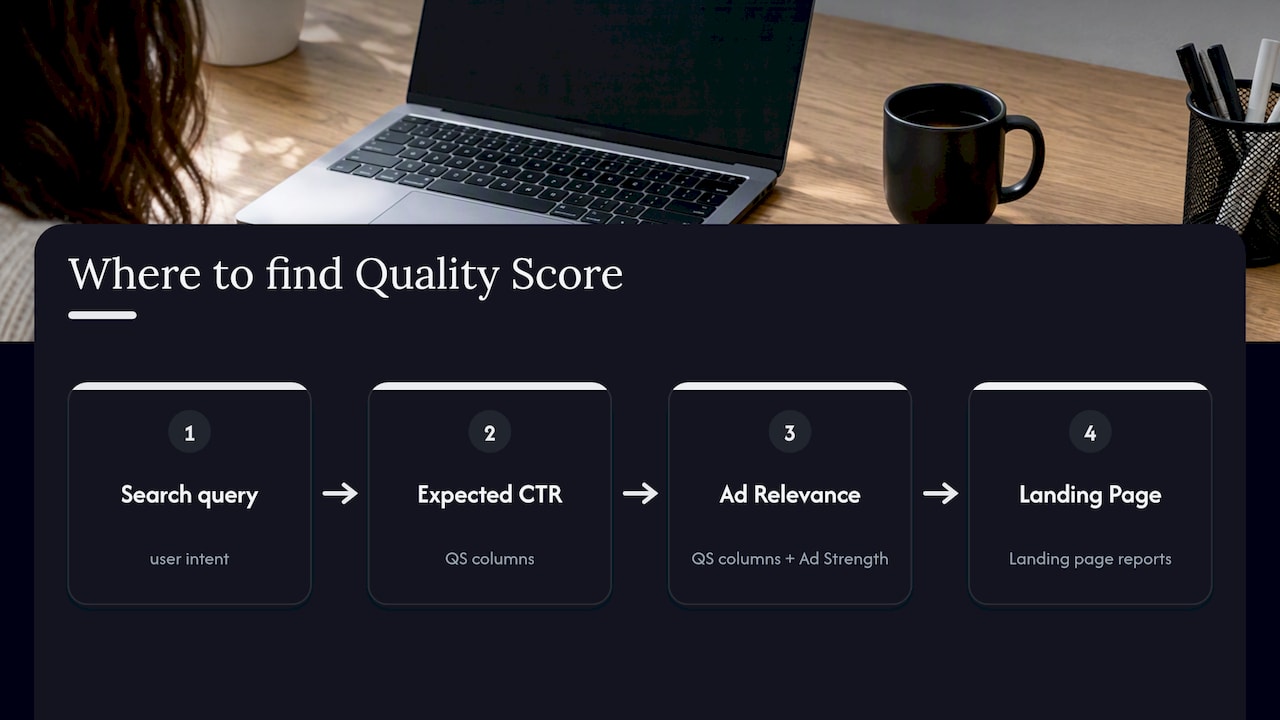
Each component isolates a different part of the user’s path from search query to landing page, and each has its own trail of evidence inside your account.
Expected CTR measures how likely people are to click your ad compared to other ads showing for that keyword, adjusted for position and other factors so a bottom-of-page ad is not punished for a naturally lower raw click rate. Weak expected CTR usually traces back to generic headlines, missing keyword insertion, or ads that look identical to what every competitor is running.
Ad relevance checks whether your ad’s actual language overlaps with what people are typing into Google. A broad ad group covering a dozen loosely related terms practically guarantees low relevance scores because no single ad can speak to every keyword in it.
Landing page experience combines topical relevance, load speed, and mobile usability. Google’s guidance recommends breaking large, broad ad groups into smaller, tightly themed groups so ad copy matches keyword intent, and notes that target load speeds for landing pages should ideally be fast enough to support a good user experience, according to Google’s Quality Score guidance.
You will find all three statuses in the Quality Score columns at the keyword level, alongside the Ad Strength indicator at the ad level and page experience signals in your landing page reports.
Pro Tip: Add the “Quality Score” and all three status columns to your keyword view before you touch a single bid, so you are optimizing with evidence instead of guesswork.
Quick diagnosis checklist for low Quality Score
Before changing anything, run through a short triage pass. This takes less than an hour for most small accounts and tells you exactly where to spend the next week.
- Pull up the Quality Score columns at the keyword level and sort by impression volume.
- Note which component (expected CTR, ad relevance, landing page experience) is marked “below average” for your highest-traffic keywords.
- Check for dashes instead of ratings: this usually means a keyword lacks enough historical data to be scored yet, which is common for low-volume terms, according to Google’s guidance on Quality Score.
- Filter by keywords edited in the last 30 days to separate new problems from long-standing ones.
- Confirm conversion tracking is firing correctly before you draw conclusions from any performance numbers.
While you are in the account, check a few structural issues that masquerade as Quality Score problems:
- Ad approval status: a disapproved or limited ad will tank performance independent of relevance.
- Budget and bid caps: a budget too low to compete can look like a CTR problem when it is really a visibility problem.
- Keyword overlap: near-duplicate keywords across ad groups can split your own traffic and dilute relevance signals.
- Device and audience targeting: overly broad targeting can pull in clicks unlikely to convert, which drags down every component indirectly.
If you want a broader troubleshooting pass before diagnosing Quality Score specifically, our checklist for ads not showing covers the five most common account-level blockers.
Fixing expected CTR and ad relevance with better ads
Most expected CTR and ad relevance problems trace back to one root cause: ad groups that try to cover too much ground with one generic ad.
Aim for a small number of closely related keywords per ad group, as recommended by Google’s guidance for keeping ad copy tightly matched to search intent, according to Google’s Quality Score guidance. When an ad group drifts past that, split it by theme rather than adding more headlines to the same ad.
Once your groups are tight, the copy itself needs to work harder:
- Mirror the exact language searchers use in your headlines, not a paraphrase of it.
- Lead with a specific benefit or number instead of a generic claim.
- Include a clear call to action that matches what happens after the click.
- Build out Responsive Search Ads with multiple distinct headlines and descriptions rather than near-duplicate variations.
Responsive Search Ads matter here because Ad Strength improves expected CTR by giving Google more creative combinations to test, and diverse headlines and descriptions help improve both ad relevance and CTR, according to Google’s guidance on optimizing ads and landing pages. For ready-to-adapt templates, our Responsive Search Ads examples guide shows headline and description combinations built for small business accounts.
One caveat worth remembering: ad assets and extensions increase clicks and visibility, but their influence is normalized out of the expected CTR component, so adding assets alone will not reliably move your 1 to 10 score even when it improves real performance, per Google’s ad optimization guidance.
Pro Tip: When you A/B test new ad copy, watch conversion rate alongside CTR. A headline that pulls more clicks but fewer conversions is not actually an improvement.
Fixing landing page experience without a site rebuild
Landing page experience is where most SMB accounts lose points, and it is also where the fastest wins hide once you know what to check.
Start with alignment: the headline and first screen of your landing page should restate the promise made in the ad, using the same keyword language a searcher typed in. A page that talks about your whole business when the ad promised a specific service creates the kind of mismatch that drags relevance scores down.
Technical performance comes next. Google’s guidance recommends a target load speed of under 2.5 seconds for landing pages, according to Google’s Quality Score guidance. Pair that with a mobile-first layout: large tap targets, readable text without zooming, and a call-to-action button visible without scrolling.
- Match page headlines to ad headlines and keyword intent word for word where possible.
- Compress images and remove unused scripts to hit the 2.5-second target.
- Test every CTA button on an actual phone, not just a resized browser window.
- Confirm conversion tracking is accurate, ideally through Google Tag Manager and Enhanced Conversions, so your data reflects real outcomes.
For a deeper look at tracking setup, our conversion tracking guide walks through a GTM checklist built for small accounts, and our conversion rate tips cover the most common friction points on service business pages.
When a full page rebuild is not realistic right now, interim fixes still help: use more specific keyword match types, narrow ad targeting to the audience your current page actually serves well, and consider a simple landing-page-specific offer that aligns tightly with the ad instead of sending traffic to a general homepage, an approach outlined in Google’s whitepaper on Quality Score.
Pro Tip: If a full redesign is weeks away, build one lightweight landing page per ad group theme instead. It is faster than a rebuild and closes most of the relevance gap.
Prioritizing fixes: a 30-day testing plan
Not every fix deserves equal attention first. Google’s whitepaper on Quality Score recommends using component statuses as warning lights and prioritizing changes by potential impact weighed against how fast you can implement them, favoring fixes like ad copy changes when site changes are slow or costly, according to Google’s whitepaper on Quality Score.
For most small accounts, that means ad copy and ad group structure come first because they take hours, not weeks, while landing page rebuilds come later because they take longer to plan and test.
- Week 1: Run the diagnosis checklist, split any ad groups over 15 keywords, and rewrite the three worst-performing ads.
- Week 2: Launch new Responsive Search Ads with distinct headline sets, and fix the single worst landing page mismatch you identified in week 1.
- Week 3: Audit and confirm conversion tracking accuracy, then start one interim landing page or offer page for your highest-spend ad group.
- Week 4: Review component status changes, compare cost per conversion against your week 1 baseline, and decide which experiments to scale, pause, or extend another cycle.
Watch cost per conversion and conversion rate as your primary decision metrics throughout, not the Quality Score number itself. A rising score with flat conversions means you have optimized for the wrong outcome.
What won’t move the needle
A few common habits waste time without fixing the underlying problem, and knowing them saves you from optimizing the wrong lever.
- Adding more ad extensions or assets will not directly raise your 1 to 10 score, since their impact is normalized out of the expected CTR component, according to Google’s guidance.
- Chasing a perfect numeric score instead of watching conversion rate and cost per conversion wastes effort on the wrong metric, per Google’s ad quality guidance.
- Moving keywords into a new ad group without also changing the ad copy or landing page rarely helps, since the mismatch simply moves with the keyword.
- Bidding more aggressively for a higher position is not a sustainable way to raise expected CTR, since position-adjusted expectations mean a better rank just raises the bar you are being measured against.
A marketer’s view on fixing Quality Score fast
Most Quality Score problems we see in small accounts come down to the same two things: ad groups built around too many unrelated keywords, and landing pages that were never built with a specific ad in mind. Fixing both usually takes less time than business owners expect.
The sequence that works best for limited budgets is simple: diagnose component statuses first, fix ad copy and ad group structure before touching the site, then build one focused landing page per theme instead of trying to redesign everything at once. Small, sequenced changes beat a full overhaul almost every time.
— TONY
How we help fix low Quality Score accounts
We offer services including diagnosing issues and improving Google Ads performance for small businesses by tightening ad group structure, rewriting ad copy to better match search language, setting up conversion tracking, and building landing pages aligned with ad promises.
Typical engagements start with an account audit to identify performance issues, followed by prioritized fixes based on effort and expected impact, concluding with a report detailing changes and their reasons. If your account has been stuck with high costs and low conversions, our advertising services page is the fastest way to request an audit and get a custom plan.
- We review component statuses and ad group structure as part of managing Google Ads accounts.
- We improve ad copy and Responsive Search Ads to better reflect customer search language.
- We set up or adjust conversion tracking to enable data-driven decision making.
- We prioritize landing page improvements by potential impact to make the most of limited budgets.
Reach out through our site to request a quick audit and see where your account’s biggest opportunity is hiding.
FAQ
What is a good Quality Score in Google Ads?
There is no single universal “good” score, since Quality Score is a relative, diagnostic signal rather than a fixed target. A better approach is watching whether your component statuses move from “below average” toward “average” or “above average” over time, alongside improving conversion rate and cost per conversion, as Google’s own guidance recommends.
Is a ROAS of 4 good?
A good return on ad spend depends heavily on your margins, industry, and sales cycle, so no fixed number applies to every business. Focus on whether your actual return covers your costs and target profit margin rather than comparing your account to a generic benchmark.
What is considered a good CTR for Google Ads?
Click-through rate benchmarks vary widely by industry, ad position, and match type, so there is no single figure that applies everywhere. A more useful signal than hitting a specific percentage is whether your expected CTR component status is rated “average” or better in your account, which reflects performance relative to competing ads for the same keywords.
How do I improve Quality Score in Google Ads?
Start by checking which of the three components (expected CTR, ad relevance, landing page experience) is rated below average, then fix the root cause rather than the symptom. Tighten ad groups to 5 to 15 closely related keywords, rewrite ad copy to mirror search language, and align landing pages with the specific promise in each ad, following the prioritization approach in Google’s Quality Score whitepaper.
Sources
- Connect ad quality to better performance – Google Ads Help
- Settling the (Quality) Score (Google whitepaper)
Recent Comments