
Auction Insights shows how your ads performed in the same auctions as other advertisers and gives directional signals you can act on to improve visibility. It covers Search, Shopping, and Performance Max campaigns, letting you compare impression share and position against the accounts you’re actually competing against. The sections below break down the six metrics, where to pull the report, and what specific moves each pattern of data should trigger.
TL;DR:
- Auction Insights percentages cover only auctions where your ad appeared; low volume can suppress keyword rows, unlike standard impression share, which uses all eligible auctions.
- Search Partners traffic is excluded, and Performance Max offers less detail than Search because automated placements do not map cleanly to keyword level auctions.
- When impression share falls while lost impression share from budget rises, increase or shift budget before raising bids, which addresses the stated cause.
- If you test Target Impression Share, set a firm maximum CPC cap and monitor cost per conversion for two to three weeks.
- Before changing bids, compare auction patterns with search terms and landing page relevance, since irrelevant query matches call for negative keywords rather than higher bids.
Table of Contents
- What the auction insights metrics actually mean
- Where to find and run the auction insights report
- Turning metric patterns into specific optimizations
- Limitations that lead advertisers to misread the report
- A six-step checklist for acting on auction insights
- Why auction insights stays a directional signal, not a verdict
- How we help you act on your auction insights data
- FAQ
- Sources
What the auction insights metrics actually mean
Auction Insights for Search campaigns reports six core statistics, and each one answers a different question about how your ads stack up against other participants in the same auctions.
- Impression share: the percentage of auctions you appeared in, out of all auctions where you were eligible to show.
- Overlap rate: how often another advertiser’s ad showed in the same auction as yours.
- Position above rate: how often another advertiser’s ad ranked higher than yours when you both showed.
- Top of page rate: how often an ad showed anywhere above the organic results.
- Absolute top of page rate: how often an ad showed in the very first position above organic results.
- Outranking share: how often your ad ranked higher than another advertiser’s, or showed when theirs didn’t.
Shopping and Performance Max campaigns report a narrower slice of these statistics, since some depend on ranked search placements that don’t apply the same way to shopping listings or asset-based formats.
One technical nuance matters here: these percentages are computed only over the auctions your account actually appeared in, not over every auction tied to your keywords. A keyword with very low volume might show incomplete or suppressed metrics simply because it didn’t generate enough auction activity to report reliably. That’s different from your standard impression share column, which is measured against all eligible auctions regardless of whether you showed.
The report is available at the account, campaign, ad group, and keyword levels, subject to minimum activity thresholds at each level, according to Google’s own documentation. A keyword with a handful of impressions a month likely won’t generate a usable Auction Insights row, while a high-volume campaign will.
Where to find and run the auction insights report
Auction Insights sits inside the Google Ads interface under the reporting menu, and the path is the same whether you’re checking a single keyword or a whole account.
- Open Insights & Reports in the left-hand menu of Google Ads.
- Select Auction Insights, then choose your level: account, campaign, ad group, or keyword.
- Switch the segment toggle between Search, Shopping, and Performance Max to see each inventory type separately.
- Apply date-range and filter controls to isolate a specific campaign, device, or geographic segment.
- For repeat monitoring, add the report to Report Editor, which supports account and manager-account views with charting so you can track trends over time instead of reading single snapshots.
- Export to CSV on a recurring schedule if you want to build your own trend file outside the platform.
Pro Tip: Pull the report at the keyword level for your top spenders first. Account-level averages can hide a competitor who’s only aggressive on your three most valuable terms.
Turning metric patterns into specific optimizations
Auction Insights only pays off when you connect a pattern in the numbers to an action you can actually take. A few combinations come up often enough to treat as playbooks.
- Rising overlap rate plus a competitor’s growing position above rate signals a new or more aggressive bidder. Test fresh ad copy and check whether your landing page still matches the query before touching bids.
- Falling impression share alongside a rising “lost IS (budget)” figure points to a budget ceiling, not a competitive loss. Raising budget or shifting spend by time of day usually fixes this faster than raising bids, a point we cover in our dayparting guidance for small budgets.
- Low absolute top of page rate despite healthy impression share suggests you’re showing but not winning the best slot, which often traces back to Quality Score or ad strength rather than bid size.
- A sudden drop in overlap with a long-standing competitor can mean they’ve paused campaigns or shifted budget elsewhere, which is worth confirming before you assume you fixed something.
When the data points toward a bidding response, Target Impression Share automates bidding toward a chosen share of auctions, but it works through a max CPC cap. Set that cap deliberately: an uncapped or overly generous ceiling can inflate cost per click fast without a matching lift in conversions.
Pro Tip: Before changing a single bid, cross-check Auction Insights against your search terms report and lost-IS columns. A position change caused by an irrelevant query match is a negative-keyword fix, not a bidding problem.
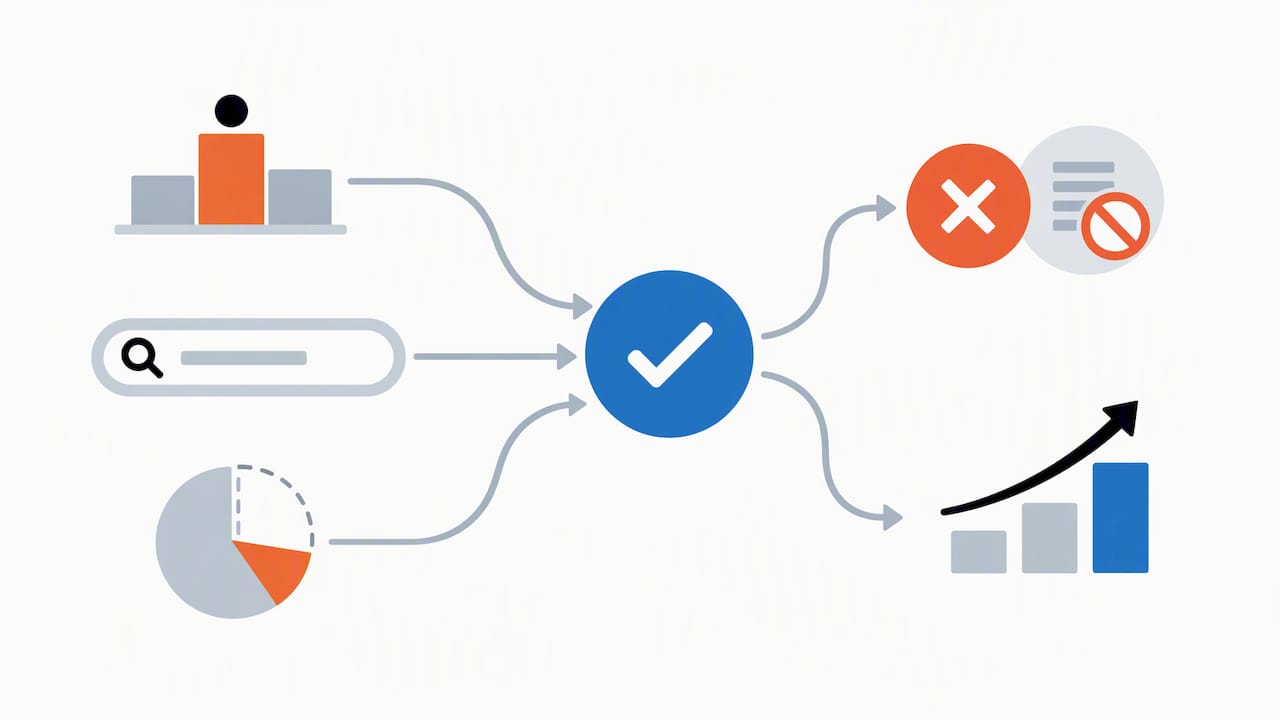
Practitioners generally treat Auction Insights as one input among several, pairing it with search-terms and landing-page data rather than acting on it in isolation, a point echoed in Search Engine Land’s practitioner guidance on the report.
Limitations that lead advertisers to misread the report
Auction Insights is directional, not exhaustive, and a few structural quirks explain why the numbers sometimes look odd.
- Minimum activity thresholds mean low-volume keywords may show blank or unreliable rows, not zero competition.
- Search Partners traffic isn’t included, so the report reflects Google Search auctions only, per Google’s own notes on advanced reporting.
- Performance Max segmentation is less granular than Search, since asset groups and automated placements don’t map cleanly to keyword-level auctions.
- Prominence metrics can fall as bids rise, because entering more auctions by bidding higher can pull your average position down even as absolute visibility improves, a pattern Google flags directly.
- Auction competitors often aren’t your real business competitors. The accounts you overlap with may be affiliates, aggregators, or resellers bidding the same terms, as Search Engine Land notes.
The safest habit is reading trends over weeks rather than single-day snapshots, pairing Auction Insights with other reports, and fixing Quality Score issues before reaching for bid increases.
A six-step checklist for acting on auction insights
This is the workflow we use when a client’s Auction Insights report needs to turn into actual campaign changes rather than just a chart to stare at.
- Start with campaigns and keywords that clear minimum activity thresholds, since sparse data misleads more than it helps.
- Use overlap and position above rate to decide which ad groups need copy tests or a landing-page review first.
- Test Target Impression Share with a hard max CPC cap, then watch cost per conversion closely for two to three weeks.
- Audit landing-page relevance and ad strength before raising any bids, since a weak page wastes the extra spend.
- Export the report monthly and set a recurring review date so competitive shifts don’t go unnoticed.
- If budget is tight, fix Quality Score and page relevance first. Those changes often lift position without costing more per click.
Pro Tip: Treat the monthly export as a trend file, not a one-off check. The second and third months are where real competitor patterns start showing up.
Why auction insights stays a directional signal, not a verdict
Auction Insights tells you who showed up and roughly where you stood, but it never tells you why a click converted or didn’t. Treat every pattern as a hypothesis, test it against copy, landing pages, and bids, then review on a fixed cadence instead of reacting to a single week’s noise.
— TONY
How we help you act on your auction insights data
Reading the report is one thing. Turning a falling position above rate into a sharper ad or a better landing page takes ongoing attention most small business owners don’t have hours for each week.
We provide campaign audits, bidding adjustments, and landing page optimizations to help turn the signals in your Auction Insights report into actual position gains. For advertisers managing several locations, pairing this with location-level response metrics can sharpen how you track performance by market. If you want a second set of eyes on what your competitors are doing in the auction, reach out through our site and we’ll walk through your account with you.
FAQ
What does auction insights mean in Google Ads?
Auction Insights is a comparison report showing how your ads performed against other advertisers bidding in the same auctions, covering metrics like impression share, overlap rate, and position above rate. It’s available for Search, Shopping, and Performance Max campaigns.
How to see auction insights in Google Ads?
Open Insights & Reports in the left-hand navigation of Google Ads, then select Auction Insights and choose your account, campaign, ad group, or keyword level. You can also add it to Report Editor for charting and trend comparisons over time.
Is $20 a day good for Google Ads?
Whether a daily budget is sufficient depends entirely on your industry’s cost per click, competition level, and conversion goals, and there’s no published figure that sets a universal benchmark. A better approach is checking your Auction Insights impression share and lost-IS columns to see whether your current budget is capping your visibility.
How does auction work in Google Ads?
Each time a search triggers ad eligibility, Google runs an auction among qualifying advertisers that weighs bid amount alongside ad quality and expected impact, determining which ads show and in what order. Auction Insights lets you see how you performed against the other participants in those same auctions, though those participants may differ from who you consider your real business competitors, according to Search Engine Land.
Why do my auction insights metrics look incomplete for some keywords?
Low-volume keywords often don’t meet the minimum activity threshold needed to generate a reliable Auction Insights row, which produces blank or partial data rather than a true zero. This is a reporting limitation tied to auction volume, not necessarily a sign of lost competitiveness.
Sources
- Use auction insights to compare performance – Google Ads Help
- Metrics | Google Ads API | Google for Developers
- How to use Google Ads Auction Insights to outrank competitors – Search Engine Land
Recent Comments